
Webhook Integration
When your monitor's status changes, you can receive notifications through a webhook.
This feature is included in every plan.
For more information, check our documentation.
All the latest features, fixes and work to OpenStatus.
When your monitor's status changes, you can receive notifications through a webhook.
This feature is included in every plan.
For more information, check our documentation.

You can now receive notifications via ntfy.sh when we detect an incident.
ntfy.sh is an open-source servicer that allows you to receive push notifications on your phone.
We love open source, so we've added this integration to our free plan.
Open source FTW 🚀

We have added support for exporting your OpenStatus synthetic checks as OpenTelemetry metrics.
Check our documentation for more information on how to set it up.
Here's an example of us exporting our synthetic checks to Grafana.
You just need an OTLP Endpoint to get started
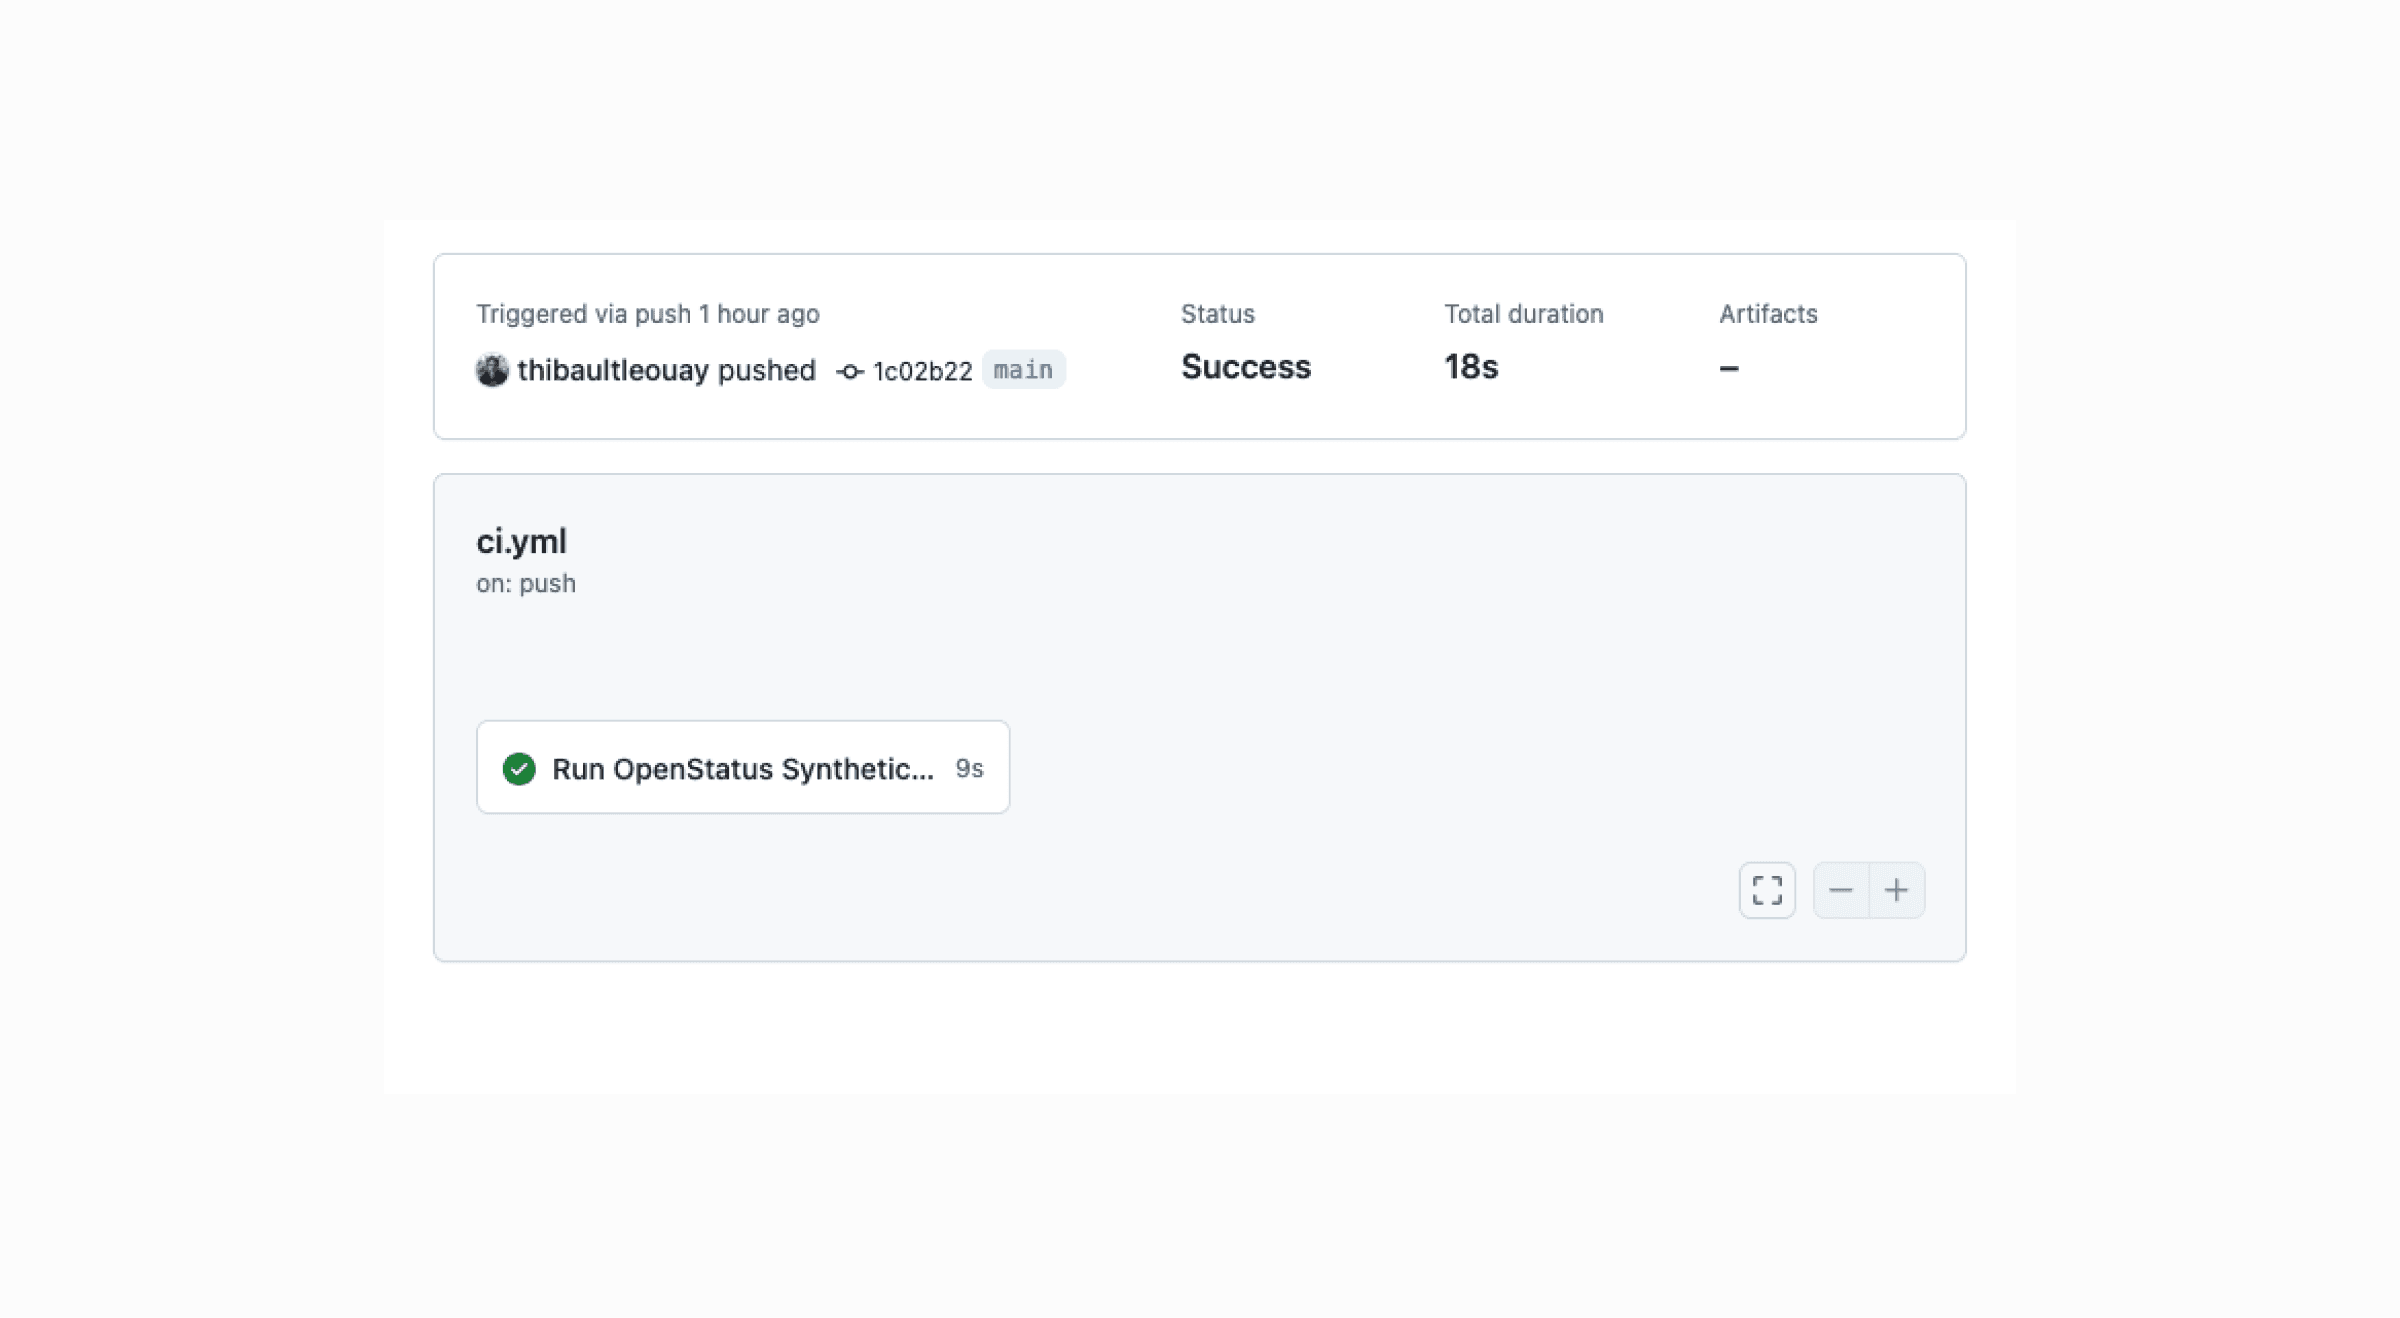
We have published our GitHub Actions, It lets your run your OpenStatus synthetic checks as part of your GitHub Workflow.
The action is available on GitHub Marketplace
Here's a simple example of how to use it:
Here's a GitHub repo with the action in use: openstatushq/openstatus-github-action-example

We have published our Raycast integration. You can now manage your monitors, status page and status updates directly from Raycast.
Here are the commands you can use:
Go to our Raycast extension page to install it.

You can now subscribe via RSS and Atom feed on any status page!
S/o to @washingtonserip for this contribution.

An online curl command line builder. Generate curl commands to test your API endpoints.
Go to the Playground and test it.

Our CLI is now available 🎉
The OpenStatus CLI gives you the power to manage your monitoring setup directly from the command line. With this new tool, you can:
To start using the CLI, simply install it using brew:
Once installed, you can run openstatus to see all available commands.
Our CLI is the first step to have a better CI integration. Stay tuned for updates! We will release our GitHub Action soon.
We're excited to continue improving the OpenStatus platform to make monitoring your applications and infrastructure even easier. As always, please let us know if you have any feedback or suggestions!

We're excited to announce that TCP monitoring is now available in OpenStatus! This new addition expands our monitoring capabilities, allowing you to keep track of all your TCP endpoints.
To start monitoring your TCP endpoints, simply add a new monitor and select "TCP" as your monitor type.
We're actively working on expanding our monitoring capabilities further with ICMP monitoring support. Stay tuned for updates!

You can now hide your request values.
We have added a checkbox within your Status Page settings to hide/show the number of total and failed requests incl. the average percentage for each monitor connected to the page.